Thursday, November 18, 2010

Norminv and Normdist

Your boss says that 27% of customers order wine that costs above a certain amount. What is that amount. Mean 24, SD4.


Notice the word ‘above’. So we want to find the value of the random variable ‘x’....here the price of the wine....that separates the top 27% of the customers from the bottom---and here’s the key---73%. Recall that Excel goes from left to right. We know the percentage, want to find the value that gives that percentage. In this case, norminv is the boy! So go
=norminv(0.73,24,4)=26.45.

Now, a contrasting problem and more complex. In a restaurant, the bills are normally distributed. The mean bill is 28, and the standard deviation is 6. If 12 of the day’s bills are over 43.06 how many customers did the restaurant have that day?
First, find the percentage of the total bills occupied by the area to the right of 43.06. Here we have the value of the random variable and we want to get the area (or probability, whichever way you want to look at it). Recall that Excel adds from left to right....and our area is clearly to the right. It says ‘above’. So go
=1-normdist(43.06,28,6,true) and get 0.006.


This means that 0.6% of the restaurant’s bills were over 43.06.
Now, we know that 0.6% of the total number of bills is 12 in number. Call the total number of bills ‘L’. We are trying to find L.
0.006*L = 12.
Divide both sides by 0.006 to find L
L = 2000.

Wednesday, November 17, 2010

Empirical Rule Worked Example


Q6. The vodka dispensing machine keeps malfunctioning. However----it can be regulated to give µ ounces (I don`t know: what measures did they use?). If the ounces of fill are normally distributed with a standard deviation of 0.4 ounces, at what value should we set µ so that a 6 ounce vodka mug will overflow only 2.5% of the time?

Answer: We know from the Empirical Rule that 95% of the observations are within 2 standard deviations of the mean. So that means that 5% of the observations are in the tails to the left and right of 95%. The normal distribution is symmetric, so each of the two tails contains 2.5% of the observations. We want to set the machine so that 6 ounces marks the point where 2.5% of the drinks overflow (dreadful waste of vodka if you ask me!). Look at my beautiful sketch. Make sure you can understand why having 2.5% in one tail means that the random variable that corresponds to that area must be 2 standard deviations from the mean.

We’re given that the standard deviation is 0.4 ounces. Two standard deviations is 0.4 * 2 = 0.8. So µ must be 0.8 ounces from 6 ounces. So we should set µ = 6 – 0.8 = 5.2 ounces.

Number of samples from a population

4. Now your mum wants in on the fun. She collected only eleven candies. How many possible samples of size four could she get from her collection?

Note that N is the notation for size of population and n is the notation for the sample. So in this case, N = 11 and n = 4. The working is below. Use the ! key on your calculator to get the numbers. The symbol ! means ‘factorial’, an instruction to multiply out all the numbers down to 1. So 4! = 4 * 3 * 2 *1 = 24

Tuesday, November 16, 2010

Chapter 8 Q17

Chapter 8 Q17

Use descriptive stats to get the data below:
Rating

Mean 6.34
Standard Error 0.30587446
Median 6.5
Mode 8
Standard Deviation 2.16285903
Sample Variance 4.67795918
Kurtosis -1.18062982
Skewness -0.14449225
Range 8
Minimum 2
Maximum 10
Sum 317
Count 50
Confidence Level(95.0%) 0.61467772

Now, the question asks us for a 95% confidence interval. n>30 so we can use the CLT. Note that the margin of error given above is for the t distribution. The margin of error for the normal distribution (that is using the CLT) will be a little narrower.
We can calculate this by hand or using Excel. Let’s have fun (!) and do both:
The M of E by hand for 95% is 1.96*0.306 (rounding up) = 0.6
In Excel we go =confidence(=0.05,2.162,50) = 0.6
So the Confidence Interval is the mean plus or minus the Margin of Error:
6.34 – 0.6 to 6.34 + 0.6 or 5.74 to 6.94
Notice that the Margin of Error for the t dist is indeed slightly larger than that for the normal distribution

Chapter 6 Q18


Chapter 6 Q18

Let’s use Excel for this question...although the answers in the book use z scores.

a. At least $40. Recall that Excel sums the probability from left to right, and we want the segment to the right of $40. So go

=1-normdist(40,30,8.2,true) = 0.111

b. No higher than $20. Now we want the segment to the left of $20, so go

=normdist(20,30,8.2,true)=0.111

Now, you may have noticed that the two answers are the same! Well, pretty weird if they weren’t....because this is a normal distribution which is by definition symmetric. The mean is bang in the middle between 20 and 40, so of course the little ‘tails’ either side are the same area.

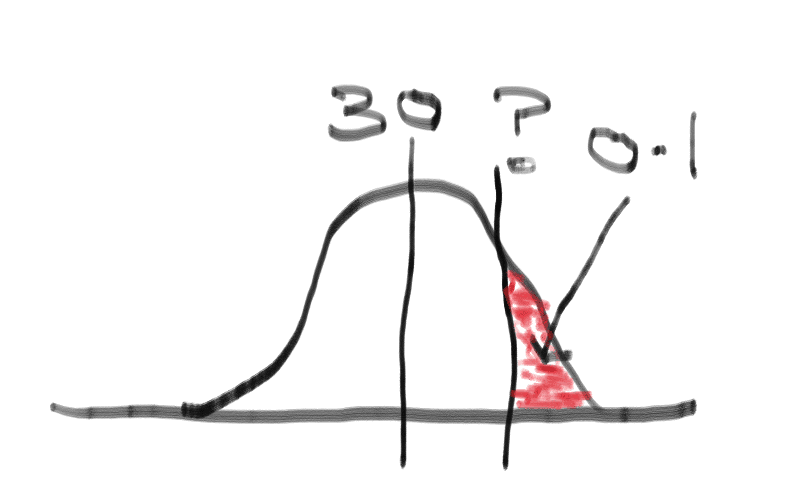
c. Now we want to know the value of the random variable ‘x’ that creates an area of 10% to the right of it? (Top 10%....) Use norminv for this, but recall that Excel sums from left to right. So go

=norminv(0.9,30,8.2)=40.51. That’s how high the stock price would have to be. See sketch below


Worked hypothesis test example

Here is an example of a typical Stephen P exam question with worked solution

15. You find that you get to love stats so much you want to take more courses! To pay the tuition fees, you get a job in a restaurant as a chef. The boss says that he always budgets for 120gm of smoked salmon in the smoked salmon omelette dish, but you suspect him of lying. You secretly measure the amounts over 42 samples. You find that the mean amount is 117gm with a sample standard deviation of 15gm. This is important: if the boss is lying you could blackmail him and get rich! (8)

a. Write the hypotheses

b. Test at 95%

c. Report your results

d. What are your conclusions?

Solutions....

a.

b. This is a two-tailed test. n > 30 so we could make use of the central limit theorem and use the normal distribution. But for myself I prefer to use the t distribution. So in Excel that’s =tdist(1.296,41,2)

giving you a p value of 0.202

c. We were asked to test at 95%, giving an alpha of 0.05. The p value that we calculated is larger than alpha (0.202 > 0.05) so following the rejection rule we fail to reject Ho.

d. Unfortunately (!) the boss is not lying so can’t blackmail him!

Monday, November 15, 2010

Chapter 8 Q1 Q2

Chapter 8 Q1

We are told the population standard deviation, so we can use normdist...or calculate by hand!


Chapter 8 Q2

The little graphics below shows how to calculate the 95% interval by hand. In Excel first find the Margin of Error:

a. =confidence(0.1, 6,50) = 1.396

b. =confidence (0.05,6,50) = 1.67

c. = confidence (0.01,6,50) = 2.19

THEN find the Confidence Interval by adding and subtracting from the mean (which is given at 32)...don't forget this part!